A video explaining the ToolZ IDE might be useful to you for this step!
Once the Report Editor is launched, quite a few tabs will be available to you.
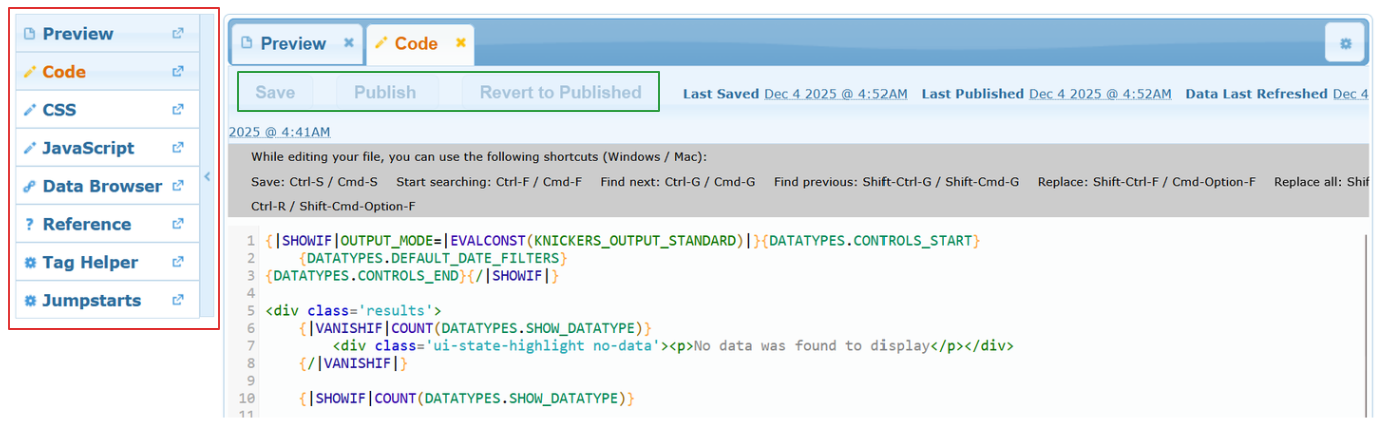
The list on the left has the following options:
- Preview: Displays the report you’re working on
- Code: Where you modify your report’s code
- CSS: Where you modify your report’s CSS
- JavaScript: Where you modify your report’s JavaScript
- Flex Browser: "Flex" Report for your data. Allows quick browsing for checking your work and making sure your data is what you expect.
- Data Browser: Basically a flat display of your data, and for seeing what you have to work with.
- Reference: Links to these docs
- Tag Helper: Dynamic tag browser to assist in figuring out what tags to use in your report
- Jumpstarts: Displays several example templates for easy reference
You can use these buttons to open a new tab, or add the tab to the main editor window on the right.
The right section of the IDE allows you to edit your code, CSS, and JS. You can use the Save button to save your progress and update the Preview, while the Publish button will actually publish the report.
While you are working on it, your changes are saved to a working copy of the report, not the published version that the users see. Once content with your changes, use the Publish button to update the version that the users see.
An asterisk after "Publish" indicates that you have saved changes that have not been published. If at any point you want to go back to the last published version, click "Revert to Published."