Graphing Service
{|RESULT|}
#start graph with the {|GRAPH|} command
{|GRAPH|}
#indicates that our graph should be of type 'line' (l)
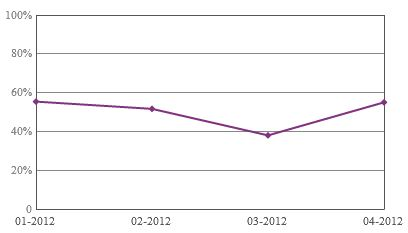
graph/t/l
#makes graph title blank
/n/%20
#graph should be 380 pixels wide
/w/380
#graph should be 250 pixels high
/h/250
#data is made of average overall score by month-year
/d/{|LOOP|RESULT.MONTH_YEAR(SORT=ORDER_NUM,RESULT_FILTER=WITH_BLANKS_IN_RANGE)}
{AVG(MONTH_YEAR.OVERALL_PERCENT_SCORE).NUMBERFORMAT(2)}{LOOP.HASNEXT?,}
{/|LOOP|}
#legend is month-year
/l/{|LOOP|RESULT.MONTH_YEAR}
{MONTH_YEAR.NAME.FUSIONSAFE}{LOOP.HASNEXT?,}
{/|LOOP|}
#indicates color scheme for graph
/c/803380
#sets the axis range from 0 to 100
/r/0,100
#formats the y axis with percentages
/f/xp
#apikey required for authentication
?apikey={CONFIG.PDF_API_KEY}
{/|GRAPH|}
{/|RESULT|}
HighCharts

{|RESULT|}
#highcharts need to be in a container
<div id='my-graph'>
{|HIGHCHARTS|}
{
#create 800x300px line graph
"chart": {
"type": "line",
"height": 300,
"width": 800,
"plotBorderWidth": 1
},
#graph's title
"title": {
"text": "Scores by Month",
"x": -20
},
#y-axis settings
"yAxis": {
"title": {
"text": ""
},
"min": 0,
"max": 100
},
#one series means no need for a legend
"legend": {
"enabled": false
},
#hide highcharts label on graphs
"credits": {
"enabled": false
},
#don't animate
"plotOptions": {
"line": {
"animation": false
}
},
#our x-axis labels. HC_SAFE_STRING escapes quotes, and quotes need to be around the category names
"xAxis":
{
"categories": [{|LOOP|RESULT.MONTH_OF_YEAR(SORT=ORDER_NUM)}
"{MONTH_OF_YEAR.NAME.HC_SAFE_STRING}"{LOOP.HASNEXT?,}
{/|LOOP|}
]
},
"series": [
{
"name": "Average Score",
#our actual data. HC_SAFE_NUMBER handles NULLs
"data": [{|LOOP|RESULT.MONTH_OF_YEAR(SORT=ORDER_NUM)}
{AVG(MONTH_OF_YEAR.PERCENT_SCORE).HC_SAFE_NUMBER}{LOOP.HASNEXT?,}
{/|LOOP|}]
}
]
}
{/|HIGHCHARTS|}
</div>
{/|RESULT|}