Use Case
Our client wants a quick and attractive way to see their most important data.
Report
Code
<div class='results'>
{|VANISHIF|COUNT(DATATYPES.SHOW_DATATYPE)}
<div class='ui-state-highlight no-data'><p>No data was found to display</p></div>
{/|VANISHIF|}
{|SHOWIF|COUNT(DATATYPES.SHOW_DATATYPE)}
<div id="satisfaction-section">
<h3 id="satisfaction-label">Satisfaction</h3>
<div class="satisfaction-graph" id="price">
<div id="price-graph">
{|HIGHCHARTS|}
{
#graph title
"title": {
"text": "Price",
"y": 120,
"style":
{
"color": "#FFDE30",
"font-size": "2.3em",
"font-family": "Gill Sans"
}
},
#graph should be 300x300 pixels
"chart": {
"height": 250,
"width": 250,
"backgroundColor":"transparent",
"marginTop": 10
},
#remove 'highcharts' label from graph
"credits": {
"enabled": false
},
"plotOptions": {
"pie": {
"borderWidth": 0,
"dataLabels": "disabled"
}
},
#our actual data
"series":
[
{
"type": "pie",
"name": "Count",
"size": "100%",
"innerSize": "80%",
"data":
[
{|RESULT|}
{|LOOP|RESULT.CLIENT_55_SURVEY_1238_QUESTION_81}
{
#label for pie slice - HC_SAFE_STRING handles escaping quotes
"name":"{CLIENT_55_SURVEY_1238_QUESTION_81.NAME.HC_SAFE_STRING}",
#actual data - HC_SAFE_NUMBER handles null values
"y":{COUNT(CLIENT_55_SURVEY_1238_QUESTION_81).HC_SAFE_NUMBER},
"color":"{CLIENT_55_SURVEY_1238_QUESTION_81.ID=1?#FFDE30:transparent}"
}{LOOP.HASNEXT?,}
{/|LOOP|}
{/|RESULT|}
]
}
]
}
{/|HIGHCHARTS|}
</div>
</div>
<div class="satisfaction-graph" id="quality">
<div id="quality-graph">
{|HIGHCHARTS|}
{
#graph title
"title": {
"text": "Quality",
"y": 120,
"style":
{
"color": "#FFDE30",
"font-size": "2.3em",
"font-family": "Gill Sans"
}
},
#graph should be 300x300 pixels
"chart": {
"height": 250,
"width": 250,
"backgroundColor":"transparent",
"marginTop": 10
},
#remove 'highcharts' label from graph
"credits": {
"enabled": false
},
"plotOptions": {
"pie": {
"borderWidth": 0,
"dataLabels": "disabled"
}
},
#our actual data
"series":
[
{
"type": "pie",
"name": "Count",
"size": "100%",
"innerSize": "80%",
"data":
[
{|RESULT|}
{|LOOP|RESULT.CLIENT_55_SURVEY_1238_QUESTION_91}
{
#label for pie slice - HC_SAFE_STRING handles escaping quotes
"name":"{CLIENT_55_SURVEY_1238_QUESTION_91.NAME.HC_SAFE_STRING}",
#actual data - HC_SAFE_NUMBER handles null values
"y":{COUNT(CLIENT_55_SURVEY_1238_QUESTION_91).HC_SAFE_NUMBER},
"color":"{CLIENT_55_SURVEY_1238_QUESTION_91.ID=1?#FFDE30:transparent}"
}{LOOP.HASNEXT?,}
{/|LOOP|}
{/|RESULT|}
]
}
]
}
{/|HIGHCHARTS|}
</div>
</div>
<div class="satisfaction-graph" id="overall">
<div id="overall-graph">
{|HIGHCHARTS|}
{
#graph title
"title": {
"text": "Overall",
"y": 120,
"style":
{
"color": "#FFDE30",
"font-size": "2.3em",
"font-family": "Gill Sans"
}
},
#graph should be 300x300 pixels
"chart": {
"height": 250,
"width": 250,
"backgroundColor":"transparent",
"marginTop": 10
},
#remove 'highcharts' label from graph
"credits": {
"enabled": false
},
"plotOptions": {
"pie": {
"borderWidth": 0,
"dataLabels": "disabled"
}
},
#our actual data
"series":
[
{
"type": "pie",
"name": "Count",
"size": "100%",
"innerSize": "80%",
"data":
[
{|RESULT|}
{|LOOP|RESULT.CLIENT_55_SURVEY_1238_QUESTION_71}
{
#label for pie slice - HC_SAFE_STRING handles escaping quotes
"name":"{CLIENT_55_SURVEY_1238_QUESTION_71.NAME.HC_SAFE_STRING}",
#actual data - HC_SAFE_NUMBER handles null values
"y":{COUNT(CLIENT_55_SURVEY_1238_QUESTION_71).HC_SAFE_NUMBER},
"color":"{CLIENT_55_SURVEY_1238_QUESTION_71.ID=1?#FFDE30:transparent}"
}{LOOP.HASNEXT?,}
{/|LOOP|}
{/|RESULT|}
]
}
]
}
{/|HIGHCHARTS|}
</div>
</div>
</div>
<div id="overall-trend">
<h3 id="overall-trend-label">By Month</h3>
<div id="overall-trend-graph">
{|RESULT|}
{|HIGHCHARTS|}
{
#create 800x300px line graph
"chart": {
"type": "line",
"height": 200,
"width": 700,
"plotBorderWidth": 0,
"backgroundColor":"transparent"
},
#graph's title
"title": {
"text": "",
"x": -20
},
#y-axis settings
"yAxis": {
"title": {
"text": ""
},
"labels":
{
"enabled": false
},
"gridLineWidth": 0
},
#one series means no need for a legend
"legend": {
"enabled": false
},
#hide highcharts label on graphs
"credits": {
"enabled": false
},
#don't animate
"plotOptions": {
"line": {
"animation": false,
"marker":
{
"radius": 3
},
"lineWidth": 6
}
},
#our x-axis labels. HC_SAFE_STRING escapes quotes, and quotes need to be around the category names
"xAxis":
{
"categories": [{|LOOP|RESULT.MONTH_YEAR(SORT=ORDER_NUM)}
""{LOOP.HASNEXT?,}
{/|LOOP|}
],
"labels":
{
"enabled": false
},
"lineWidth": 0,
"tickWidth": 0,
"minorGridLineWidth": 0,
"lineColor": "transparent",
"minorTickLength": 0,
"tickLength": 0
},
"colors": ["#FFB638"],
"series": [
{
"name": "Average Score",
#our actual data. HC_SAFE_NUMBER handles NULLs
"data": [{|LOOP|RESULT.MONTH_YEAR(SORT=ORDER_NUM,RESULT_FILTER=WITH_BLANKS_IN_RANGE)}
{AVG(MONTH_YEAR.PERCENT_SCORE).HC_SAFE_NUMBER}{LOOP.HASNEXT?,}
{/|LOOP|}]
}
]
}
{/|HIGHCHARTS|}
</div>
<div id="overall-text">
{|LOOP|RESULT.MONTH_YEAR}
{|SHOWIF|LOOP.ISFIRST}
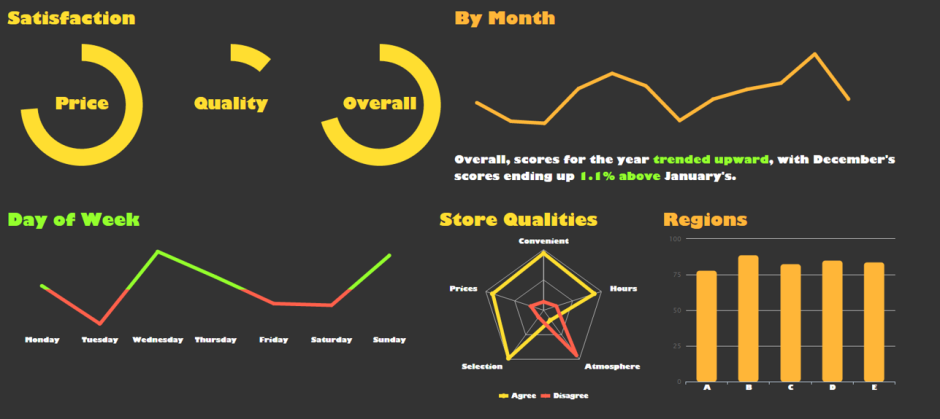
Overall, scores for the year <span class="{CALC(NEXT(AVG(MONTH_YEAR.PERCENT_SCORE),11) - AVG(MONTH_YEAR.PERCENT_SCORE))>0?positive:negative}-change">trended {CALC(NEXT(AVG(MONTH_YEAR.PERCENT_SCORE),11) - AVG(MONTH_YEAR.PERCENT_SCORE))>0?upward:downward}</span>, with December's scores ending up
<span class="{CALC(NEXT(AVG(MONTH_YEAR.PERCENT_SCORE),11) - AVG(MONTH_YEAR.PERCENT_SCORE))>0?positive:negative}-change">{CALC(NEXT(AVG(MONTH_YEAR.PERCENT_SCORE),11) - AVG(MONTH_YEAR.PERCENT_SCORE)).ROUND(1)}% {CALC(NEXT(AVG(MONTH_YEAR.PERCENT_SCORE),11) - AVG(MONTH_YEAR.PERCENT_SCORE))>0?above:below}</span> January's.
{/|SHOWIF|}
{/|LOOP|}
</div>
{/|RESULT|}
</div>
<div id="day-of-week-trend">
<h3 id="day-of-week-trend-label">Day of Week</h3>
<div id="day-of-week-trend-graph">
{|RESULT|}
{|HIGHCHARTS|}
{
#create 800x300px line graph
"chart": {
"type": "line",
"height": 200,
"width": 700,
"plotBorderWidth": 0,
"backgroundColor":"transparent"
},
#graph's title
"title": {
"text": "",
"x": -20
},
#y-axis settings
"yAxis": {
"title": {
"text": ""
},
"labels":
{
"enabled": false
},
"gridLineWidth": 0
},
#one series means no need for a legend
"legend": {
"enabled": false
},
#hide highcharts label on graphs
"credits": {
"enabled": false
},
#don't animate
"plotOptions": {
"line": {
"animation": false,
"marker":
{
"radius": 3
},
"lineWidth": 6
}
},
#our x-axis labels. HC_SAFE_STRING escapes quotes, and quotes need to be around the category names
"xAxis":
{
"categories": [{|LOOP|RESULT.DAY_OF_WEEK(SORT=ORDER_NUM)}
"{DAY_OF_WEEK.NAME.HC_SAFE_STRING}"{LOOP.HASNEXT?,}
{/|LOOP|}
],
"labels":
{
"enabled": true,
"style":
{
"color": "white",
"font-family": "Gill Sans",
"font-size": "1em"
}
},
"lineWidth": 0,
"tickWidth": 0,
"minorGridLineWidth": 0,
"lineColor": "transparent",
"minorTickLength": 0,
"tickLength": 0
},
"colors": ["#FFDE30"],
"series": [
{
"name": "Average Score",
#our actual data. HC_SAFE_NUMBER handles NULLs
"data": [{|LOOP|RESULT.DAY_OF_WEEK(SORT=ORDER_NUM,RESULT_FILTER=WITH_BLANKS)}
{AVG(DAY_OF_WEEK.PERCENT_SCORE).HC_SAFE_NUMBER}{LOOP.HASNEXT?,}
{|VANISHIF|LOOP.HASNEXT}
],
"threshold": {AVG(DAY_OF_WEEK.PERCENT_SCORE, OVERALL)},
"negativeColor": "#FF604B",
"color": "#94FF2C"
{/|VANISHIF|}
{/|LOOP|}
}
]
}
{/|HIGHCHARTS|}
</div>
{/|RESULT|}
</div>
<div id="agreement-section">
<h3 id="qualities-label">Store Qualities</h3>
<div id="agreement-radar">
{|HIGHCHARTS|}
{
"chart": {
"polar": true,
"type": "line",
"height": 300,
"width": 350,
"plotBorderWidth": 0,
"backgroundColor":"transparent"
},
"title": {
"text": "",
"x": -20
},
"xAxis": {
"categories": ["Convenient", "Hours", "Atmosphere", "Selection", "Prices"],
"tickmarkPlacement": "on",
"lineWidth": 0,
"labels":
{
"style":
{
"color": "white",
"font-family": "Gill Sans",
"font-size": "1em"
}
}
},
"credits": {
"enabled": false
},
"yAxis": {
"gridLineInterpolation": "polygon",
"lineWidth": 0,
"min": 0,
"max": 50,
"labels":
{
"enabled": false
}
},
"legend":
{
"borderColor": "transparent",
"itemStyle":
{
"color": "white",
"font-family": "Gill Sans",
"font-size": "0.9em"
}
},
"plotOptions":
{
"line":
{
"lineWidth": 6
}
},
"colors": ["#FFDE30","#FF604B"],
"series": [
{
"name": "Agree",
"data": [
{COUNT(DATATYPES.SHOW_DATATYPE(FILTER=CLIENT_55_SURVEY_1238_QUESTION_21_ID|lte|2))},
{COUNT(DATATYPES.SHOW_DATATYPE(FILTER=CLIENT_55_SURVEY_1238_QUESTION_31_ID|lte|2))},
{COUNT(DATATYPES.SHOW_DATATYPE(FILTER=CLIENT_55_SURVEY_1238_QUESTION_41_ID|lte|2))},
{COUNT(DATATYPES.SHOW_DATATYPE(FILTER=CLIENT_55_SURVEY_1238_QUESTION_51_ID|lte|2))},
{COUNT(DATATYPES.SHOW_DATATYPE(FILTER=CLIENT_55_SURVEY_1238_QUESTION_31_ID|lte|2))}
],
"pointPlacement": "on"
},
{
"name": "Disagree",
"data": [
{COUNT(DATATYPES.SHOW_DATATYPE(FILTER=CLIENT_55_SURVEY_1238_QUESTION_21_ID|gte|4))},
{COUNT(DATATYPES.SHOW_DATATYPE(FILTER=CLIENT_55_SURVEY_1238_QUESTION_31_ID|gte|4))},
{COUNT(DATATYPES.SHOW_DATATYPE(FILTER=CLIENT_55_SURVEY_1238_QUESTION_41_ID|gte|4))},
{COUNT(DATATYPES.SHOW_DATATYPE(FILTER=CLIENT_55_SURVEY_1238_QUESTION_51_ID|gte|4))},
{COUNT(DATATYPES.SHOW_DATATYPE(FILTER=CLIENT_55_SURVEY_1238_QUESTION_31_ID|gte|4))}
],
"pointPlacement": "on"
}
]
}
{/|HIGHCHARTS|}
</div>
</div>
<div id="regions">
<h3 id="region-label">Regions</h3>
{|RESULT|}
<div id='my-graph'>
{|HIGHCHARTS|}
{
"chart": {
"type": "column",
"height": 280,
"width": 400,
"plotBorderWidth": 0,
"backgroundColor":"transparent"
},
"title": {
"text": "",
"x": -20
},
"yAxis": {
"title": {
"text": ""
},
"min": 0,
"max": 100
},
"legend": {
"enabled": false
},
"credits": {
"enabled": false
},
"plotOptions": {
"column": {
"animation": false
},
"series": {
"borderRadius": 5,
"borderColor": "transparent"
}
},
"colors": ["#FFB638"],
"xAxis":
{
"categories": [{|LOOP|RESULT.CLIENT_55_LEVEL_3(SORT=ORDER_NUM)}
"{CLIENT_55_LEVEL_3.NAME.SPLIT( ,1).HC_SAFE_STRING}"{LOOP.HASNEXT?,}
{/|LOOP|}
],
"labels":
{
"style":
{
"color": "white",
"font-family": "Gill Sans",
"font-size": "1em"
}
}
},
"series": [
{
"name": "Count",
"data": [{|LOOP|RESULT.CLIENT_55_LEVEL_3(SORT=ORDER_NUM)}
{AVG(CLIENT_55_LEVEL_3.PERCENT_SCORE).HC_SAFE_NUMBER}{LOOP.HASNEXT?,}
{/|LOOP|}]
}
]
}
{/|HIGHCHARTS|}
</div>
{/|RESULT|}
</div>
{/|SHOWIF|}
</div>
CSS
/* css for SUMMITInfographic1409669984396 */
body
{
background-color: #333;
font-family: "Gill Sans";
font-size: 1.2em;
margin: 1em;
}
.results
{
width: 1500px;
}
#satisfaction-section
{
height: 300px;
float: left;
}
#overall-trend
{
height: 300px;
margin-bottom: 2em;
}
#day-of-week-trend
{
height: 300px;
float: left;
}
#regions
{
height: 300px;
}
#agreement-section
{
height: 300px;
width: 350px;
float: left;
margin-left: 1.3em;
margin-right: 1.3em;
}
#satisfaction-label,
#qualities-label
{
color: #FFDE30;
}
#overall-trend-label,
#region-label
{
color: #FFB638;
}
#day-of-week-trend-label
{
color: #94FF2C;
}
h3
{
margin-bottom: 0.3em;
}
.satisfaction-graph
{
float: left;
}
#overall-text
{
color: white;
}
.positive-change
{
color: #94FF2C;
}
.negative-change
{
color: #FF604B;
}