Use Case
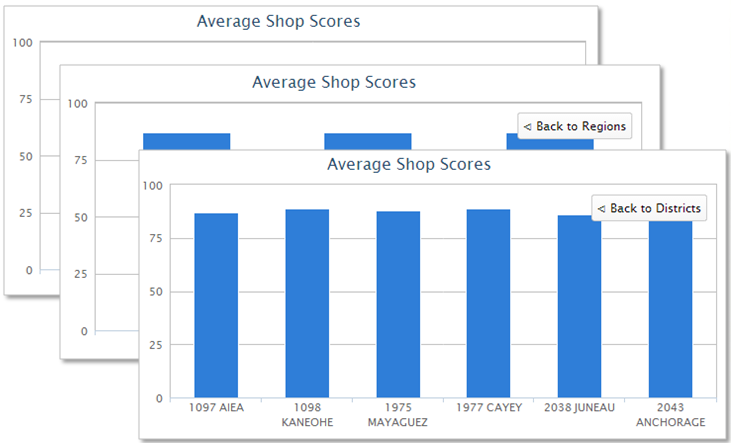
Our client wants to see a graph of their region’s average shop scores. They want to be able to click on the regions to drill down into district scores, and drill down from there into their location scores.
Report
Code
{|SHOWIF|OUTPUT_MODE=|EVALCONST(KNICKERS_OUTPUT_STANDARD)|}{DATATYPES.CONTROLS_START}
{DATATYPES.DEFAULT_DATE_FILTERS}
{DATATYPES.CONTROLS_END}{/|SHOWIF|}
<div class='results'>
{|VANISHIF|COUNT(DATATYPES.SHOW_DATATYPE)}
<div class='ui-state-highlight no-data'><p>No data was found to display</p></div>
{/|VANISHIF|}
{|SHOWIF|COUNT(DATATYPES.SHOW_DATATYPE)}
{|NESTED|}
<div id='my-graph'>
{|HIGHCHARTS|}
{
"chart": {
"type": "column",
"height": 300,
"width": 600,
"plotBorderWidth": 1
},
"title": {
"text": "Average Shop Scores",
"x": -20
},
"yAxis": {
"title": {
"text": ""
},
"min": 0,
"max": 100
},
"xAxis": {
"type": "category"
},
"legend": {
"enabled": false
},
"credits": {
"enabled": false
},
"plotOptions": {
"column": {
"animation": false
}
},
"series": [
#first, we setup a region series, with just the region scores
{
"name": "Regions",
"data": [
{|LOOP|NESTED.CLIENT_55_LEVEL_3(SORT=NAME)}
{
#label it with the region name
"name":"{CLIENT_55_LEVEL_3.NAME.HC_SAFE_STRING}",
#the value is our region's average score
"y": {AVG(CLIENT_55_LEVEL_3.PERCENT_SCORE, CLIENT_55_LEVEL_3).ROUND.HC_SAFE_NUMBER},
#tell this what to drill down into
"drilldown":{CLIENT_55_LEVEL_3.ID}
#loop district and location just to avoid errors
{|LOOP|CLIENT_55_LEVEL_3.CLIENT_55_LEVEL_2(SORT=NAME)}
{|LOOP|CLIENT_55_LEVEL_2.CLIENT_55_LEVEL_1(SORT=NAME)}{/|LOOP|}
{/|LOOP|}
}{LOOP.HASNEXT?,}
{/|LOOP|}]
}
],
#then, setup our drilldown series
"drilldown":
{
"series":[
#setup a series for the districts in each region
{|LOOP|RESULT.CLIENT_55_LEVEL_3}
{
"name":"Districts",
#it's important to give it this id, so the graph knows to drill down to it
"id":{CLIENT_55_LEVEL_3.ID},
"data": [
#loop the districts
{|LOOP|CLIENT_55_LEVEL_3.CLIENT_55_LEVEL_2(SORT=NAME)}
{
#label it with the district name
"name":"{CLIENT_55_LEVEL_2.NAME.HC_SAFE_STRING}",
#the value is our district's average score
"y": {AVG(CLIENT_55_LEVEL_2.PERCENT_SCORE, CLIENT_55_LEVEL_2).ROUND.HC_SAFE_NUMBER},
#tell this what to drill down into
"drilldown":{CLIENT_55_LEVEL_2.ID}
#loop the locations to avoid errors
{|LOOP|CLIENT_55_LEVEL_2.CLIENT_55_LEVEL_1(SORT=NAME)}{/|LOOP|}
}{LOOP.HASNEXT?,}
{/|LOOP|}
]
},
#now, setup a series for each district's locations
{|LOOP|CLIENT_55_LEVEL_3.CLIENT_55_LEVEL_2(SORT=NAME)}
{
"name":"Average Score",
#it's important to give it this id, so the graph knows to drill down to it
"id":{CLIENT_55_LEVEL_2.ID},
"data": [
{|LOOP|CLIENT_55_LEVEL_2.CLIENT_55_LEVEL_1(SORT=NAME)}
{
"name":"{CLIENT_55_LEVEL_1.NAME.HC_SAFE_STRING}",
"y": {AVG(CLIENT_55_LEVEL_1.PERCENT_SCORE, CLIENT_55_LEVEL_1).ROUND.HC_SAFE_NUMBER}
}{LOOP.HASNEXT?,}
{/|LOOP|}
]
}{LOOP.HASNEXT?,}
{/|LOOP|}
{LOOP.HASNEXT?,}
{/|LOOP|}
]
}
}
{/|HIGHCHARTS|}
</div>
{/|NESTED|}
{/|SHOWIF|}
</div>
CSS
@import "themeroller/jquery.ui.all.css";
@import "chrome.theme.css";
@import "chrome.layout.css";