Use Case
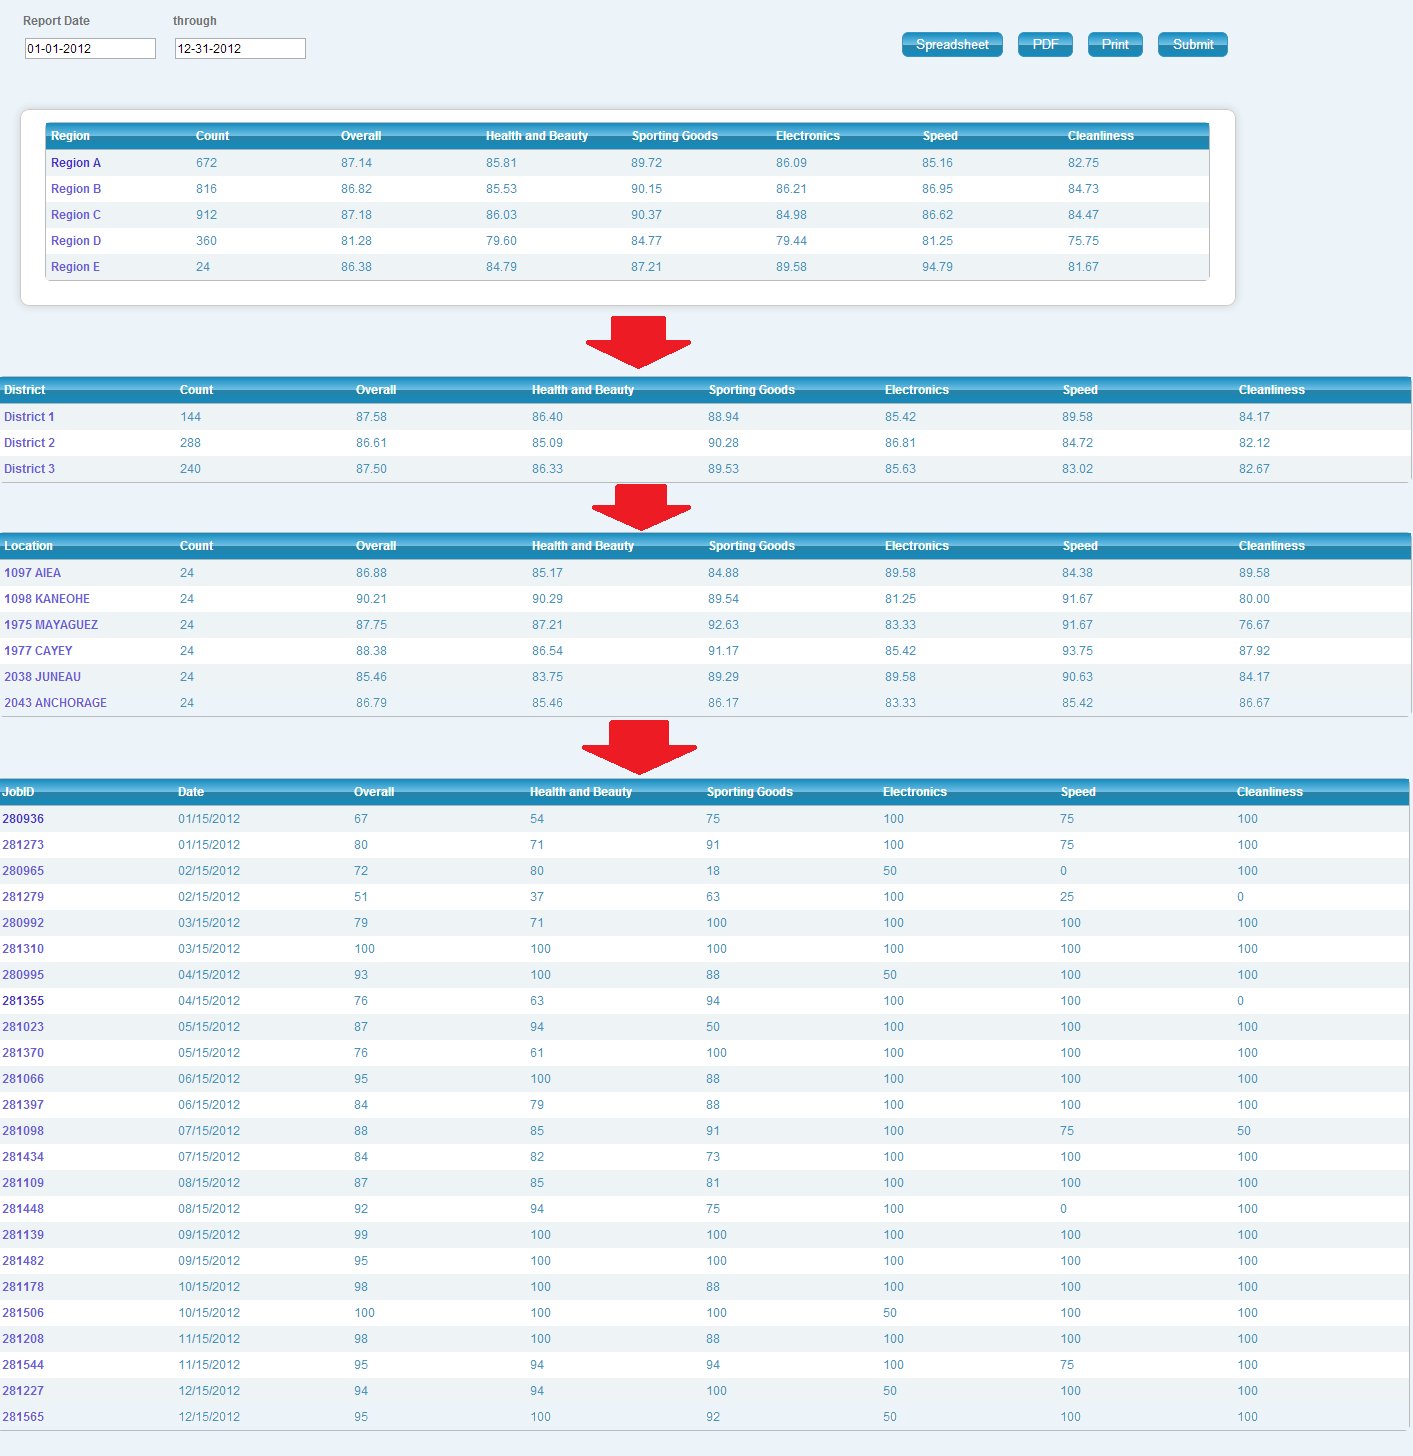
The client would like to see a report in the style of the Company Overview, displaying levels and their shop counts, average overall scores, and average sectional scores. They want to be able to drill down through the levels to see more detail, finally ending up at a shop log.
Report
Code
{|SHOWIF|OUTPUT_MODE=|EVALCONST(KNICKERS_OUTPUT_STANDARD)|}{DATATYPES.CONTROLS_START}
{DATATYPES.DEFAULT_DATE_FILTERS}
{DATATYPES.CONTROLS_END}{/|SHOWIF|}
<div class='results'>
#if no data found
{|VANISHIF|COUNT(DATATYPES.SHOW_DATATYPE)}
<div class='ui-state-highlight no-data'><p>No data was found to display</p></div>
{/|VANISHIF|}
#if data found
{|SHOWIF|COUNT(DATATYPES.SHOW_DATATYPE)}
#if we have no group, show region by default
{|VANISHIF|DATATYPES.REPORT_CONFIG.SHOW_GROUP_ID}
{|RESULT|}
{|LOOP|RESULT.CLIENT_49_LEVEL_3(SORT=NAME)}
{|SHOWIF|LOOP.ISFIRST}
<div>
<table class='data' id='data'>
<thead>
<tr>
<th>{|SORT_TOGGLE|CLIENT_49_LEVEL_3.NAME}{DATATYPES.SHOW_DATATYPE.CLIENT_49_LEVEL_3.NAME}{/|SORT_TOGGLE|}</th>
<th>{|SORT_TOGGLE|COUNT(CLIENT_49_LEVEL_3)}Count{/|SORT_TOGGLE|}</th>
<th>{|SORT_TOGGLE|AVG(CLIENT_49_LEVEL_3.PERCENT_SCORE)}Overall{/|SORT_TOGGLE|}</th>
#display our sectional score headers
{|LOOP|CLIENT_49_LEVEL_3.PROPERTIES(FILTER=type|eq|sectional_percent_score,SORT=ORDER_NUM)}
<th>{|SORT_TOGGLE|AVG(CLIENT_49_LEVEL_3.|EVALTAG(PROPERTIES.PROPERTY_ID)|)}{PROPERTIES.NAME.SPLIT(:,1)}</th>
{/|LOOP|}
</tr>
</thead>
<tbody>
{/|SHOWIF|}
<tr>
#build a drill-down link
#we need to include datatype so that it knows what datatype to display on the next page
#show_group_id indicates what group we want to see on the next page (in this case, district)
#include a filterby for our current region
#and include the trending date before/after filters
<th>
<a href="../xjump/DrilldownCompanyOverview1392834536546?datatype={DATATYPES.REPORT_CONFIG.DATATYPE}&show_group_id=client_49_level_2&filterby=client_49_level_3_id,eq,{CLIENT_49_LEVEL_3.ID}&trending_date_after={DATATYPES.REPORT_CONFIG.TRENDING_DATE_AFTER.FORMATTED(Y-m-d)}&trending_date_before={DATATYPES.REPORT_CONFIG.TRENDING_DATE_BEFORE.FORMATTED(Y-m-d)}">
{CLIENT_49_LEVEL_3.NAME}
</a>
</th>
<td>{COUNT(CLIENT_49_LEVEL_3)}</td>
<td>{AVG(CLIENT_49_LEVEL_3.PERCENT_SCORE).NUMBERFORMAT(2)}</td>
#display our average sectional scores
{|LOOP|CLIENT_49_LEVEL_3.PROPERTIES(FILTER=type|eq|sectional_percent_score,SORT=ORDER_NUM)}
<td>{AVG(CLIENT_49_LEVEL_3.PROPERTIES.VALUE).NUMBERFORMAT(2)}</td>
{/|LOOP|}
</tr>
{/|LOOP|}
</tbody>
</table>
</div>
{/|RESULT|}
{/|VANISHIF|}
#otherwise, show the group we've been asked for
{|SHOWIF|DATATYPES.REPORT_CONFIG.SHOW_GROUP_ID}
# don't show a group if we should be showing datapoints
{|VANISHIF|DATATYPES.REPORT_CONFIG.SHOW_GROUP_ID=datapoints}
{|RESULT|}
{|LOOP|RESULT.SHOW_GROUP(SORT=NAME)}
{|SHOWIF|LOOP.ISFIRST}
<div>
<table class='data' id='data'>
<thead>
<tr>
<th>{|SORT_TOGGLE|SHOW_GROUP.NAME}{DATATYPES.SHOW_DATATYPE.SHOW_GROUP.NAME}{/|SORT_TOGGLE|}</th>
<th>{|SORT_TOGGLE|COUNT(SHOW_GROUP)}Count{/|SORT_TOGGLE|}</th>
<th>{|SORT_TOGGLE|AVG(SHOW_GROUP.PERCENT_SCORE)}Overall{/|SORT_TOGGLE|}</th>
{|LOOP|SHOW_GROUP.PROPERTIES(FILTER=type|eq|sectional_percent_score,SORT=ORDER_NUM)}
<th>{|SORT_TOGGLE|AVG(SHOW_GROUP.|EVALTAG(PROPERTIES.PROPERTY_ID)|)}{PROPERTIES.NAME.SPLIT(:,1)}{/|SORT_TOGGLE|}</th>
{/|LOOP|}
</tr>
</thead>
<tbody>
{/|SHOWIF|}
<tr>
#build a drill-down link
#we need to include datatype so that it knows what datatype to display on the next page
#show_group_id indicates what group we want to see on the next page (in this case, either location or datapoints depending on the current group)
#include a filterby for our current district or location
#and include the trending date before/after filters
<th><a href="../xjump/DrilldownCompanyOverview1392834536546?datatype={DATATYPES.REPORT_CONFIG.DATATYPE}&show_group_id={DATATYPES.REPORT_CONFIG.SHOW_GROUP_ID=client_49_level_2?client_49_level_1:datapoints}&filterby={DATATYPES.REPORT_CONFIG.SHOW_GROUP_ID}_id,eq,{SHOW_GROUP.ID}&trending_date_after={DATATYPES.REPORT_CONFIG.TRENDING_DATE_AFTER.FORMATTED(Y-m-d)}&trending_date_before={DATATYPES.REPORT_CONFIG.TRENDING_DATE_BEFORE.FORMATTED(Y-m-d)}">{SHOW_GROUP.NAME}</a></th>
<td>{COUNT(SHOW_GROUP)}</td>
<td>{AVG(SHOW_GROUP.PERCENT_SCORE).NUMBERFORMAT(2)}</td>
{|LOOP|SHOW_GROUP.PROPERTIES(FILTER=type|eq|sectional_percent_score,SORT=ORDER_NUM)}
<td>{AVG(SHOW_GROUP.PROPERTIES.VALUE).NUMBERFORMAT(2)}</td>
{/|LOOP|}
</tr>
{/|LOOP|}
</tbody>
</table>
</div>
{/|RESULT|}
{/|VANISHIF|}
#finally, display datapoints at the lowest level
{|SHOWIF|DATATYPES.REPORT_CONFIG.SHOW_GROUP_ID=datapoints}
{|RESULT|}
{|LOOP|RESULT.DATAPOINTS(SORT=TRENDING_TIMESTAMP)}
{|SHOWIF|LOOP.ISFIRST}
<div>
<table class='data' id='data'>
<thead>
<tr>
<th>{|SORT_TOGGLE|ID}JobID{/|SORT_TOGGLE|}</th>
<th>{|SORT_TOGGLE|TRENDING_TIMESTAMP}Date{/|SORT_TOGGLE|}</th>
<th>{|SORT_TOGGLE|PERCENT_SCORE}Overall{/|SORT_TOGGLE|}</th>
{|LOOP|DATAPOINTS.PROPERTIES(FILTER=type|eq|sectional_percent_score,SORT=ORDER_NUM)}
<th>{|SORT_TOGGLE||EVALTAG(PROPERTIES.PROPERTY_ID)|}{PROPERTIES.NAME.SPLIT(:,1)}{/|SORT_TOGGLE|}</th>
{/|LOOP|}
</tr>
</thead>
<tbody>
{/|SHOWIF|}
<tr>
#show a link to the SASSIE client shop view
<th><a href="http://www.sassieshop.com/2su/clients/ClientShopView.php?JobID={DATAPOINTS.ID}" target="_blank">{DATAPOINTS.ID}</a></th>
<td>{DATAPOINTS.TRENDING_TIMESTAMP.FORMATTED(m/d/Y)}</td>
<td>{DATAPOINTS.PERCENT_SCORE}</td>
{|LOOP|DATAPOINTS.PROPERTIES(FILTER=type|eq|sectional_percent_score,SORT=ORDER_NUM)}
<td>{DATAPOINTS.PROPERTIES.VALUE}</td>
{/|LOOP|}
</tr>
{/|LOOP|}
</tbody>
</table>
</div>
{/|RESULT|}
{/|SHOWIF|}
#end if group found
{/|SHOWIF|}
#end if results found
{/|SHOWIF|}
</div>
CSS
/* css for CompanyOverviewDrilldown1350400998759 */
@import "themeroller/jquery.ui.all.css";
@import "chrome.theme.css";
@import "chrome.layout.css";
#data
{
width: auto;
margin: auto;
}
#data thead a
{
color: white;
text-decoration: underline;
}
/***** clean *****/
body {
background: #99bbcc;
}
.wrap {
padding: 2em 0;
}
header.main, .header.main {
background: transparent;
border: 0;
padding: 0;
-moz-box-shadow: none;
-webkit-box-shadow: none;
box-shadow: none;
}
#content {
background: #ecf4f9;
border: 9px solid #fff;
padding: 0;
-moz-border-radius: 9px;
-webkit-border-radius: 9px;
border-radius: 9px;
-moz-box-shadow: 0px 0px 12px #3a6478;
-webkit-box-shadow: 0px 0px 12px #3a6478;
box-shadow: 0px 0px 12px #3a6478;
}
fieldset {
background: #ecf4f9;
border: 0;
padding: 1em;
text-align: right;
}
fieldset > div, fieldset .level-input {
float: left;
width: 25%;
text-align: left;
}
fieldset .date-input {
width: 50%;
}
fieldset .date-input div {
float: left;
margin-left: 15px;
}
fieldset .controls, fieldset .ui-controls {
float: right;
margin: 18px 18px 0 0;
text-align: right;
width: 40%;
}
fieldset .controls button {
background: #138bbf; /* Old browsers */
background: -moz-linear-gradient(top, #138bbf 0%, #72c1e5 50%, #2982a5 51%, #138bbf 100%); /* FF3.6+ */
background: -webkit-gradient(linear, left top, left bottom, color-stop(0%,#138bbf), color-stop(50%,#72c1e5), color-stop(51%,#2982a5), color-stop(100%,#138bbf)); /* Chrome,Safari4+ */
background: -webkit-linear-gradient(top, #138bbf 0%,#72c1e5 50%,#2982a5 51%,#138bbf 100%); /* Chrome10+,Safari5.1+ */
background: -o-linear-gradient(top, #138bbf 0%,#72c1e5 50%,#2982a5 51%,#138bbf 100%); /* Opera 11.10+ */
background: -ms-linear-gradient(top, #138bbf 0%,#72c1e5 50%,#2982a5 51%,#138bbf 100%); /* IE10+ */
background: linear-gradient(to bottom, #138bbf 0%,#72c1e5 50%,#2982a5 51%,#138bbf 100%); /* W3C */
filter: progid:DXImageTransform.Microsoft.gradient( startColorstr='#138bbf', endColorstr='#138bbf',GradientType=0 ); /* IE6-9 */
border: 1px solid #4095bf;
color: #fff;
font-size: 1.1em;
float: right;
margin-left: 1em;
padding: .25em 1em;
-moz-border-radius: 6px;
-webkit-border-radius: 6px;
border-radius: 6px;
}
fieldset .controls button:hover {
background: #2982a5;
border: 2px solid #111;
color: #fff;
-moz-box-shadow: 0px 0px 12px #fff;
-webkit-box-shadow: 0px 0px 12px #fff;
box-shadow: 0px 0px 12px #fff;
border: 1px solid #fff;
}
.results {
background: #fff;
border: 1px solid #ccc;
margin: 2em;
padding: 1em 2em 2em 2em;
-moz-border-radius: 9px;
-webkit-border-radius: 9px;
border-radius: 9px;
-moz-box-shadow: 0px 0px 12px #ccc;
-webkit-box-shadow: 0px 0px 12px #ccc;
box-shadow: 0px 0px 12px #ccc;
}
.results:before,
.results:after {
content:"";
display:table;
}
.results:after {
clear:both;
}
table#data {
border: 1px solid #bbb;
float: none;
width: 100%;
-moz-border-radius: 6px;
-webkit-border-radius: 6px;
border-radius: 6px;
}
thead th {
background: #138bbf; /* Old browsers */
background: -moz-linear-gradient(top, #138bbf 0%, #72c1e5 50%, #2982a5 51%, #138bbf 100%); /* FF3.6+ */
background: -webkit-gradient(linear, left top, left bottom, color-stop(0%,#138bbf), color-stop(50%,#72c1e5), color-stop(51%,#2982a5), color-stop(100%,#138bbf)); /* Chrome,Safari4+ */
background: -webkit-linear-gradient(top, #138bbf 0%,#72c1e5 50%,#2982a5 51%,#138bbf 100%); /* Chrome10+,Safari5.1+ */
background: -o-linear-gradient(top, #138bbf 0%,#72c1e5 50%,#2982a5 51%,#138bbf 100%); /* Opera 11.10+ */
background: -ms-linear-gradient(top, #138bbf 0%,#72c1e5 50%,#2982a5 51%,#138bbf 100%); /* IE10+ */
background: linear-gradient(to bottom, #138bbf 0%,#72c1e5 50%,#2982a5 51%,#138bbf 100%); /* W3C */
filter: progid:DXImageTransform.Microsoft.gradient( startColorstr='#138bbf', endColorstr='#138bbf',GradientType=0 ); /* IE6-9 */
color: #fff;
}
table tbody tr:nth-child(odd) {
background: #eef4f6;
color: #4095bf;
}
table tbody tr:nth-child(even) {
background: #fff;
color: #4095bf;
}
table tbody tr th {
background: transparent
}
table tbody tr:hover {
background: orange;
color: #fff;
}
table tbody tr:hover .cleanliness-value-1 {
background-color: #00aa00;
background-color: #88cc00;
color: #fff;
}
table tbody tr:hover .cleanliness-value-2 {
background-color: #aaff22;
background-color: #dfff80;
color: #4095bf;
}
table tbody tr:hover .cleanliness-value-3 {
background-color: #ffff22;
background-color: #fff266;
color: #4095bf;
}
table tbody tr:hover .cleanliness-value-4 {
background-color: #ff1111;
background-color: #ff8c66;
color: #fff;
}
#summary-graph .grapher {
margin: 0 auto;
text-align: center;
}
/***** print mode *****/
body.output-mode-print,
.output-mode-print #content,
.output-mode-print .results
{
background: #fff;
border: 0;
margin: 0 auto;
padding: 0;
-moz-box-shadow: none;
-webkit-box-shadow: none;
box-shadow: none;
}
.output-mode-print .results {
margin: 2em;
}