Use Case
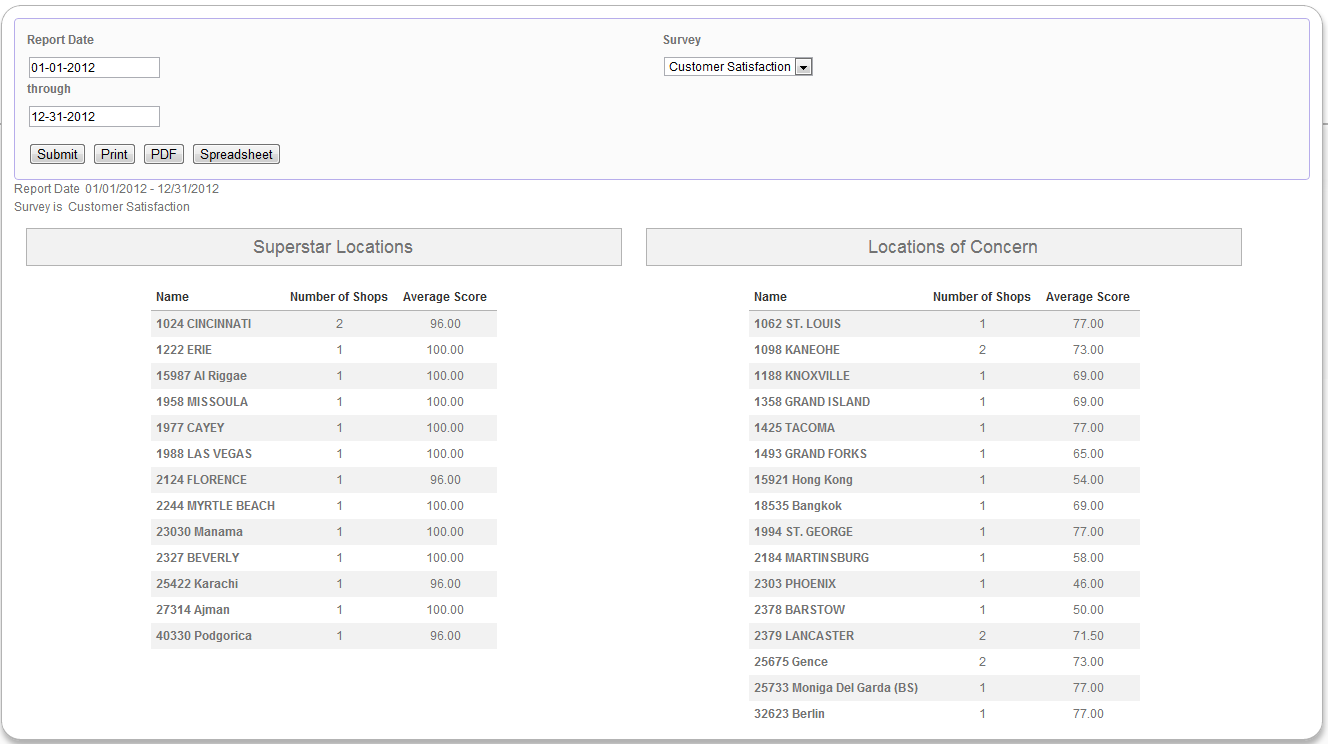
The client would like to see a list of its locations that are doing very well (average score over 95%) and doing very poorly (average score less than 80%). They would also like to see how many shops have been done at each location, as well as be able to filter by survey.
Report
Code
{|SHOWIF|OUTPUT_MODE=|EVALCONST(KNICKERS_OUTPUT_STANDARD)|}{DATATYPES.CONTROLS_START}
{DATATYPES.DEFAULT_DATE_FILTERS}
<div>
<label>{DATATYPES.SHOW_DATATYPE.CLIENT_49_SURVEY.GROUP.NAME}</label>
{DATATYPES.SHOW_DATATYPE.CLIENT_49_SURVEY_SELECTOR.INPUT}
</div>
{DATATYPES.CONTROLS_END}{/|SHOWIF|}
<div class='results'>
{|VANISHIF|DATATYPES.SHOW_DATATYPE.TOTAL_COUNT}
<div class='ui-state-highlight no-data'><p>No data was found to display</p></div>
{/|VANISHIF|}
{|SHOWIF|DATATYPES.SHOW_DATATYPE.TOTAL_COUNT}
#display what filters were used
{DATATYPES.FILTER_LIST}
#superstar locations - ones with scores over 95%
{|RESULT|}
<div id="outstanding-locations">
<h3>Superstar Locations</h3>
<table class='data'>
<thead>
<tr>
<th>Name</th>
<th>Number of Shops</th>
<th>Average Score</th>
</tr>
</thead>
<tbody>
#filter by location average score greater than 95% and sort by name
{|LOOP|RESULT.CLIENT_49_LEVEL_1(SORT=NAME,FILTER=AVG(CLIENT_49_LEVEL_1.PERCENT_SCORE)|gt|95)}
<tr>
<th>{CLIENT_49_LEVEL_1.NAME}</th>
<td>{COUNT(CLIENT_49_LEVEL_1)}</td>
<td>{AVG(CLIENT_49_LEVEL_1.PERCENT_SCORE).NUMBERFORMAT(2)}</td>
</tr>
{/|LOOP|}
</tbody>
</table>
</div>
{/|RESULT|}
#concerning locations - ones with scores less than 80%
{|RESULT|}
<div id="concerning-locations">
<h3>Locations of Concern</h3>
<table class='data'>
<thead>
<tr>
<th>Name</th>
<th>Number of Shops</th>
<th>Average Score</th>
</tr>
</thead>
<tbody>
#filter by location average score less than 80% and sort by name
{|LOOP|RESULT.CLIENT_49_LEVEL_1(SORT=NAME,FILTER=AVG(CLIENT_49_LEVEL_1.PERCENT_SCORE)|lt|80)}
<tr>
<th>{CLIENT_49_LEVEL_1.NAME}</th>
<td>{COUNT(CLIENT_49_LEVEL_1)}</td>
<td>{AVG(CLIENT_49_LEVEL_1.PERCENT_SCORE).NUMBERFORMAT(2)}</td>
</tr>
{/|LOOP|}
</tbody>
</table>
</div>
{/|RESULT|}
{/|SHOWIF|}
</div>
CSS
@import "themeroller/jquery.ui.all.css";
@import "chrome.theme.css";
@import "chrome.layout.css";
#outstanding-locations,
#concerning-locations
{
width:46%;
float:left;
margin-left: 1em;
margin-right: 1em;
margin-top: 1em;
}
#outstanding-locations table,
#concerning-locations table
{
width:auto;
margin:auto;
}
.data td
{
text-align:center;
}