Use Case
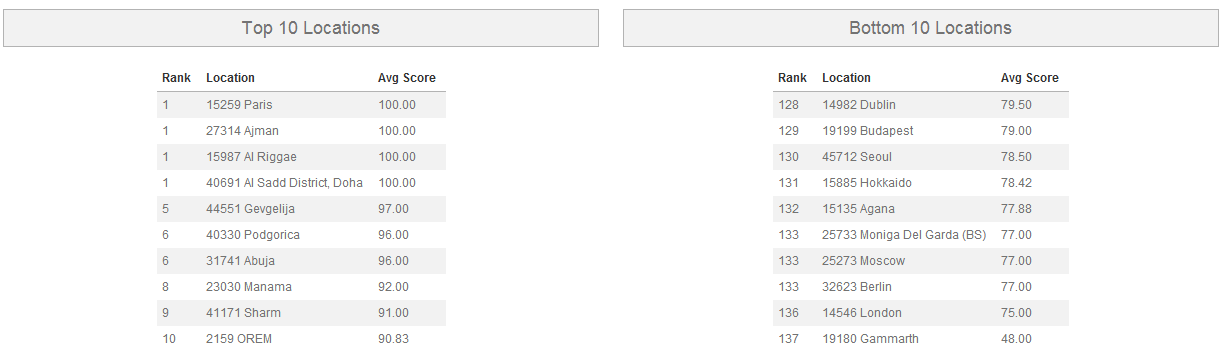
The client would like to know which of their locations are doing the best and worst, as determined by average overall score. They would also like to see the locations’ ranks.
Report
Code
{|SHOWIF|OUTPUT_MODE=|EVALCONST(KNICKERS_OUTPUT_STANDARD)|}{DATATYPES.CONTROLS_START}
{DATATYPES.DEFAULT_DATE_FILTERS}
{DATATYPES.CONTROLS_END}{/|SHOWIF|}
<div class='results'>
{|VANISHIF|DATATYPES.SHOW_DATATYPE.TOTAL_COUNT}
<div class='ui-state-highlight no-data'><p>No data was found to display</p></div>
{/|VANISHIF|}
{|SHOWIF|DATATYPES.SHOW_DATATYPE.TOTAL_COUNT}
#top 10 locations table
{|RESULT|}
<div id="top-10-locations">
<h3>Top 10 Locations</h3>
<table class='data'>
<thead>
<tr>
<th>Rank</th>
<th>{DATATYPES.SHOW_DATATYPE.CLIENT_49_LEVEL_1.NAME}</th>
<th>Avg Score</th>
</tr>
</thead>
<tbody>
#sort our rows by average overall score, highest to lowest
#limit to 10 locations
{|LOOP|RESULT.CLIENT_49_LEVEL_1(SORT=AVG(CLIENT_49_LEVEL_1.PERCENT_SCORE)|DESC,LIMIT=10)}
<tr>
#display how this location ranks by average overall score out of all locations
#we're using a precision of 2 here to round the average score to the same
#precision that we're displaying to the user
<td>{RANK(AVG(CLIENT_49_LEVEL_1.PERCENT_SCORE),DESC,2,OVERALL)}</td>
<td>{CLIENT_49_LEVEL_1.NAME}</td>
<td>{AVG(CLIENT_49_LEVEL_1.PERCENT_SCORE).NUMBERFORMAT(2)}</td>
</tr>
{/|LOOP|}
</tbody>
</table>
</div>
{/|RESULT|}
#bottom 10 locations table
{|RESULT|}
<div id="bottom-10-locations">
<h3>Bottom 10 Locations</h3>
<table class='data'>
<thead>
<tr>
<th>Rank</th>
<th>{DATATYPES.SHOW_DATATYPE.CLIENT_49_LEVEL_1.NAME}</th>
<th>Avg Score</th>
</tr>
</thead>
<tbody>
#sort our rows by average overall score, highest to lowest
#limit to 10 locations with an offset of -10 (i.e., the last 10)
{|LOOP|RESULT.CLIENT_49_LEVEL_1(SORT=AVG(CLIENT_49_LEVEL_1.PERCENT_SCORE)|DESC,LIMIT=-10|10)}
<tr>
#again, we display the rank
<td>{RANK(AVG(CLIENT_49_LEVEL_1.PERCENT_SCORE),DESC,2,OVERALL)}</td>
<td>{CLIENT_49_LEVEL_1.NAME}</td>
<td>{AVG(CLIENT_49_LEVEL_1.PERCENT_SCORE).NUMBERFORMAT(2)}</td>
</tr>
{/|LOOP|}
</tbody>
</table>
</div>
{/|RESULT|}
{/|SHOWIF|}
</div>
CSS
@import "themeroller/jquery.ui.all.css";
@import "chrome.theme.css";
@import "chrome.layout.css";
#top-10-locations,
#bottom-10-locations
{
width:46%;
float:left;
margin-left: 1em;
margin-right: 1em;
margin-top: 1em;
}
#top-10-locations table,
#bottom-10-locations table
{
width:auto;
margin:auto;
}