Use Case
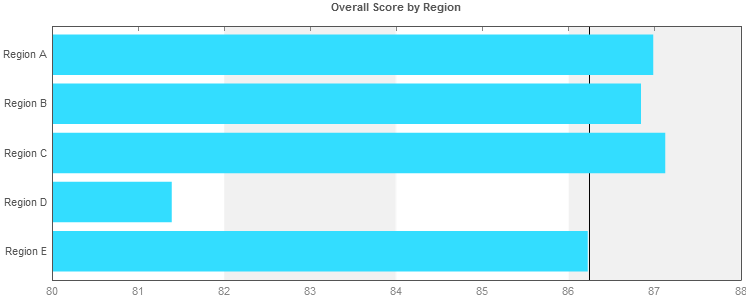
The client would like to see how their regions are doing on overall survey scores (both Mystery Shopping and Customer Satisfaction). They would like a way to easily compare the regional scores to the overall average.
Report
Code
{|SHOWIF|OUTPUT_MODE=|EVALCONST(KNICKERS_OUTPUT_STANDARD)|}{DATATYPES.CONTROLS_START}
{DATATYPES.DEFAULT_DATE_FILTERS}
{DATATYPES.CONTROLS_END}{/|SHOWIF|}
<div class='results'>
{|VANISHIF|DATATYPES.SHOW_DATATYPE.TOTAL_COUNT}
<div class='ui-state-highlight no-data'><p>No data was found to display</p></div>
{/|VANISHIF|}
{|SHOWIF|DATATYPES.SHOW_DATATYPE.TOTAL_COUNT}
{|RESULT|}
{|GRAPH|}
graph/t/bh
/w/750
/h/310
/n/Overall%20Score%20by%20Region
# loop through our regions
/d/{|LOOP|RESULT.CLIENT_49_LEVEL_3(SORT=ORDER_NUM)}
{AVG(CLIENT_49_LEVEL_3.PERCENT_SCORE).ROUND(2)}{LOOP.HASNEXT?,}
# when we get to the last region, also include the overall average
{|VANISHIF|LOOP.HASNEXT}
/hr/{AVG(CLIENT_49_LEVEL_3.PERCENT_SCORE,OVERALL).ROUND(2)}
{/|VANISHIF|}
{/|LOOP|}
# x-axis labels
/l/{|LOOP|RESULT.CLIENT_49_LEVEL_3(SORT=ORDER_NUM)}
{CLIENT_49_LEVEL_3.NAME.URLENCODE}{LOOP.HASNEXT?,}
{/|LOOP|}
/c/33ddff,000000
#turn off gridlines
/gl/0
?apikey={CONFIG.PDF_API_KEY}
{/|GRAPH|}
{/|RESULT|}
{/|SHOWIF|}
CSS
@import "themeroller/jquery.ui.all.css";
@import "chrome.theme.css";
@import "chrome.layout.css";
.results
{
text-align:center;
}